
CHOOSING THE RIGHT REPORT FOR YOUR COMPANY
To review which reports are best for your company, it helps to understand what each report category contains and when you should use them to answer specific business questions.
SALES BY TIME
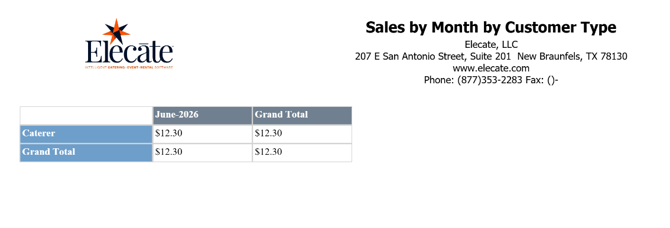
Reports that break down your sales by monthly periods, showing how revenue flows when viewed through different lenses (customer type, individual customer, event type, location, or salesperson).
Use these reports when you need to understand trends and patterns over time. They answer questions about seasonal behavior, growth momentum, and how different parts of your business perform across consecutive months. This is your go-to category when comparing "this month versus last month" or identifying which quarters are strongest.
SALES BY TWO DIMENSIONS
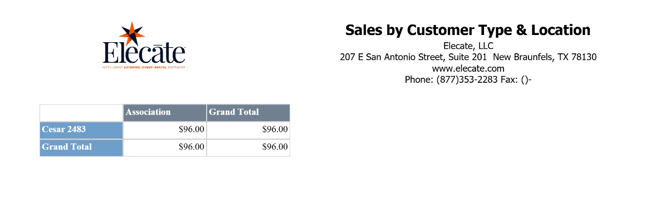
Reports that combine two key business factors together (customer type + location, customer type + referral source, salesperson + customer, salesperson + customer type) without breaking them down by time period. These show aggregated totals across your entire selected date range.
Use these reports when you want a complete strategic picture of how different business attributes interact. They're essential for understanding your customer composition, identifying which segments are most valuable, and assessing how different parts of your team or market perform in relation to each other.
SALES FORECASTS
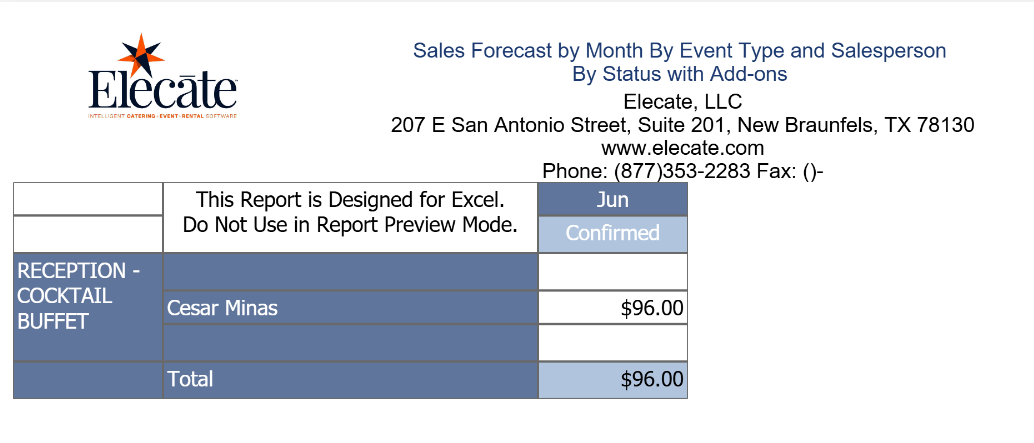
Reports that project your future revenue based on current bookings and historical patterns. Unlike reports showing what happened, forecasts show what you expect to happen in the upcoming months. They come in multiple levels of detail—from high-level summaries to granular breakdowns that separate base revenue from add-on revenue.
Use forecast reports when you need to plan ahead and allocate resources intelligently. Whether you're planning staffing levels, managing cash flow, setting realistic targets for the team, or understanding capacity needs, these reports give you a forward-looking view of your business.
STAFFING & OPERATIONAL

Reports that track specific operational expenses—particularly per diem payments made to staff, contractors, and catering teams. It provides a detailed record of these payments by event and by individual.
Use this report when you need to manage and verify labor costs. It's essential for expense reconciliation, policy compliance checking, and understanding your total cost structure. If you need to audit where money is going in staffing expenses, this is the report that provides that transparency.
SALES PIPELINE
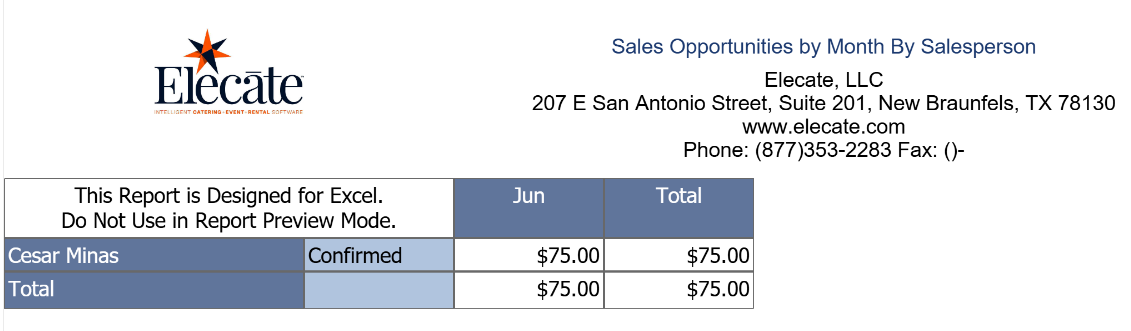
Reports showing your open sales opportunities (potential deals not yet closed) broken down by salesperson and month. This gives you a window into what business is potentially coming down the pipeline.
Use this report when you want to assess the health and strength of your future business. It answers whether your forecast is realistic, whether you have enough opportunity in the funnel to hit targets, and whether individual salespeople are actively working new business or just managing existing commitments.
EVENT STATUS SUMMARIES
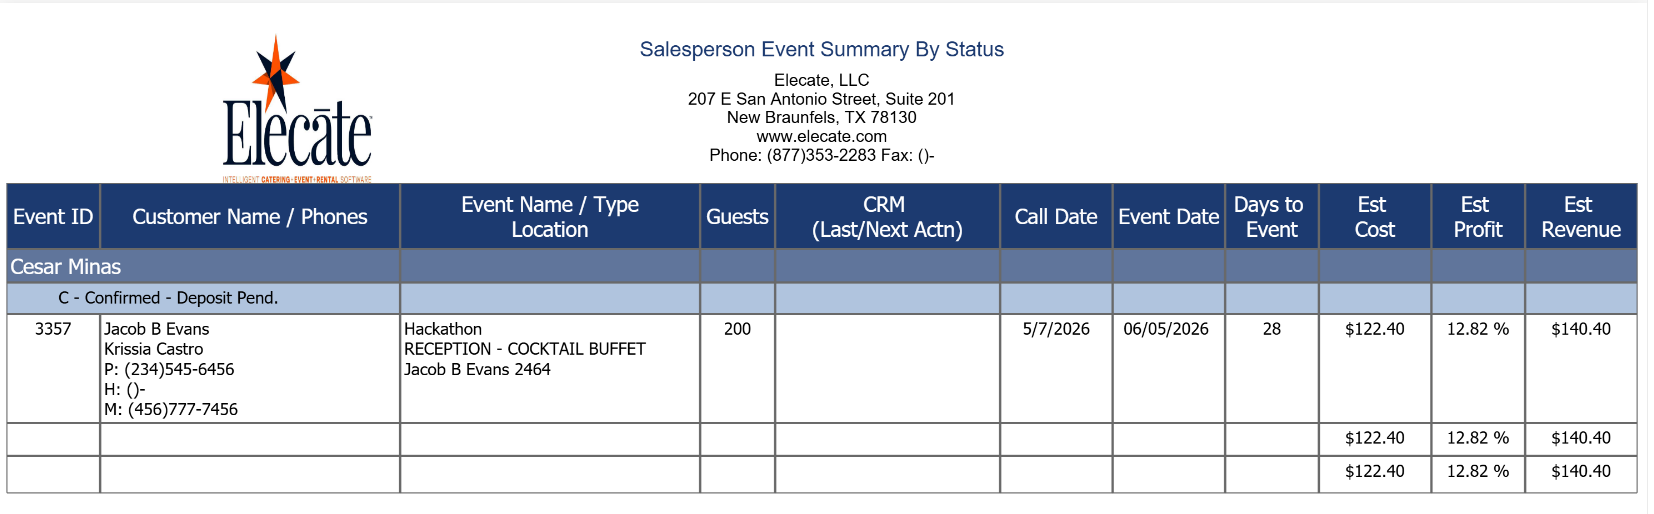
Reports that categorize all your events by their lifecycle stage (Pending, Active, Completed, Cancelled) and break them down by salesperson. This shows the health and execution status of your event business.
When your company should use it: Use this report when you want to understand how well events are being executed and completed. It reveals bottlenecks in your workflow, shows where events might be getting stuck, and helps assess whether your team is moving events through their lifecycle efficiently.
ACTUAL REVENUE
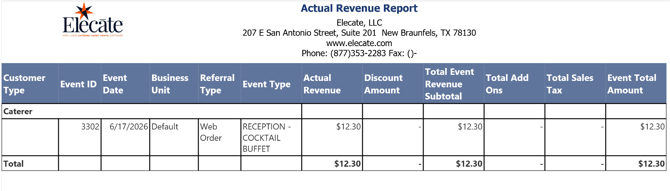
Reports showing revenue that has already been completed and received—the actual, verified results of your business. One shows revenue event-by-event, another segments this actual revenue by customer type and by referral source to show your current customer composition and channel effectiveness.
Use actual revenue reports when you need verified, factual performance data. These are your truth-telling reports for financial reporting, performance verification, and reconciliation. When you need to show board members, accountants, or stakeholders what really happened, these are the reports you pull.
REVENUE ESTIMATES BY DIMENSION
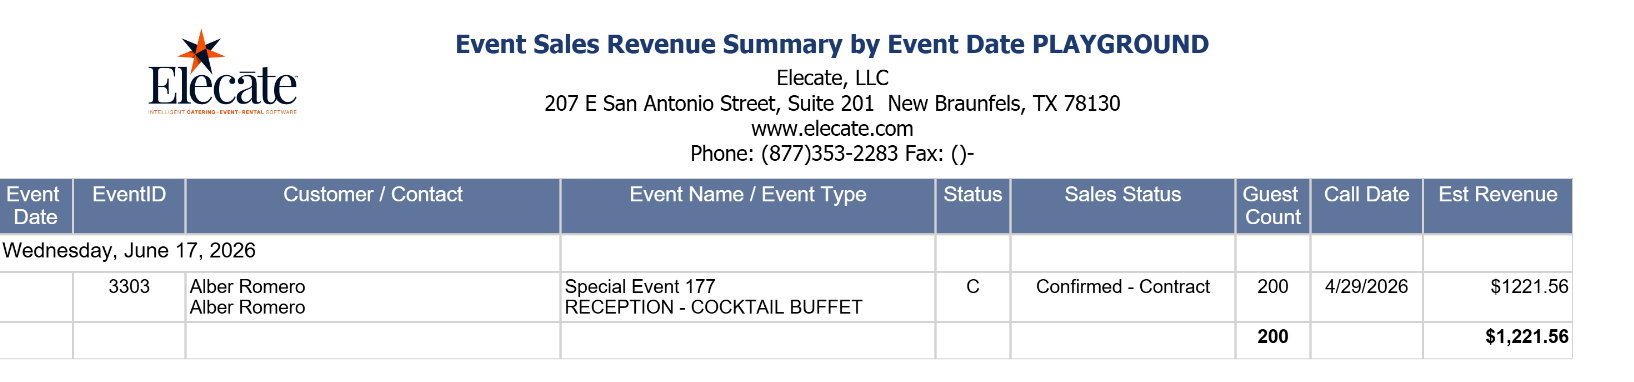
Reports that estimate revenue potential broken down by specific dimensions: by event date, by referral source, by salesperson, or by event status. They show what you expect to receive from different parts of your business.
When your company should use it: Use these reports when you want to understand revenue potential from different angles. They help with strategic decisions about where to invest marketing effort, which channels are most valuable, and which parts of your pipeline represent the biggest opportunity.
EVENT SALES CROSS-DIMENSIONAL
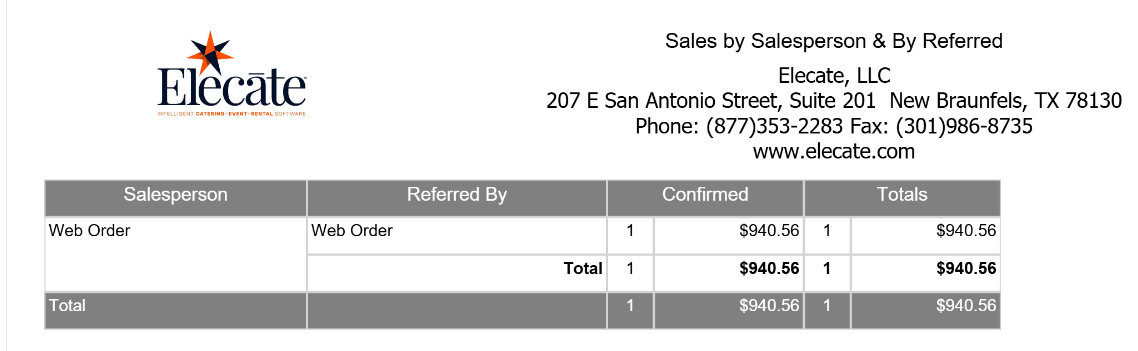
Reports that analyze event sales by combining multiple business perspectives—such as salesperson + referral source, or events grouped by client project/matter. These provide unique angles for understanding what drives success in your business.
When your company should use it: Use these reports when you want to discover hidden patterns and optimize your go-to-market strategy. They reveal which combinations of factors produce the best results and help you identify where your team is most effective.
FLASH SALES
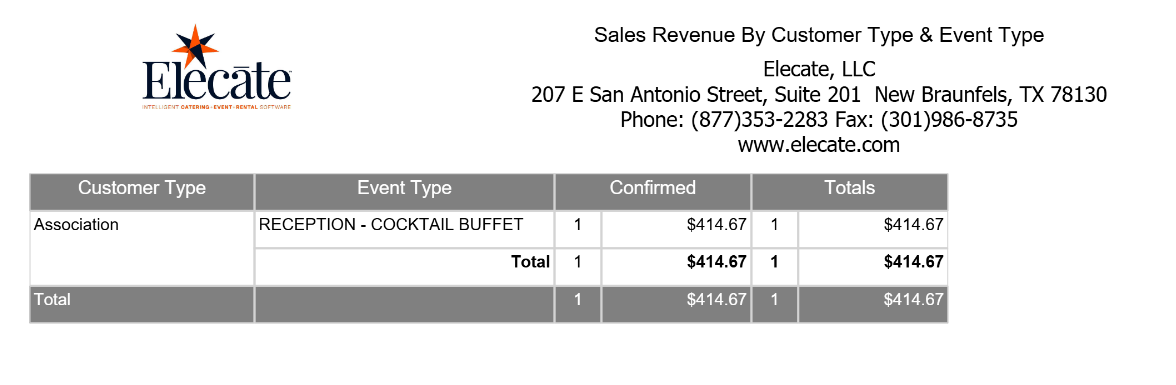
Reports that analyze your quick-turn, rapid-booking business from multiple angles—by customer type and event type combo, by day of week, by month, by week, or by referral source. Flash sales are tracked separately because they often operate with different economics and conversion rates than standard bookings.
When your company should use it: Use flash sales reports when you want to understand the dynamics of your quick-turn business separately from your standard booking model. If flash sales are significant to your business, these reports help you optimize that channel and understand its unique characteristics.
FORECAST & PACE REPORTS
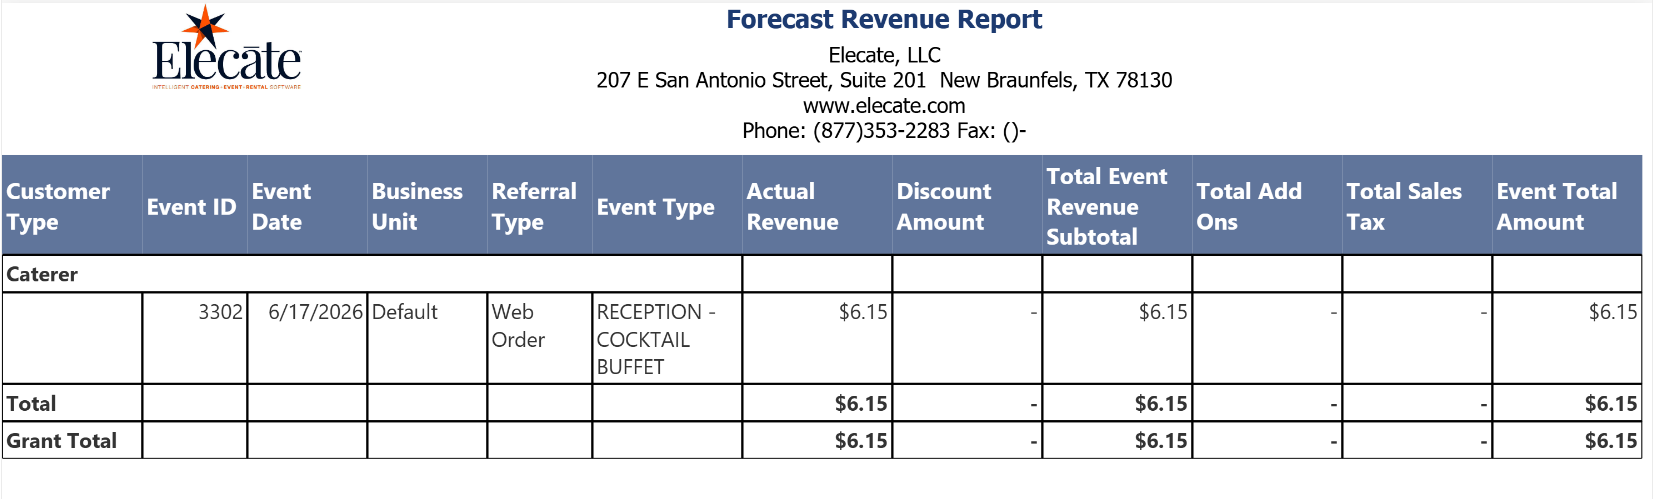
High-level, company-wide reports that take a strategic view of your business. One shows your aggregated revenue forecast across the entire company, the other compares your current sales pace against your targets to show if you're on track to hit goals.
When your company should use it: Use these reports when you need a bird's-eye view suitable for executive reporting and board discussions. They're dashboard-level reports that show business trajectory and goal attainment without getting into details about individual customers or salespeople.